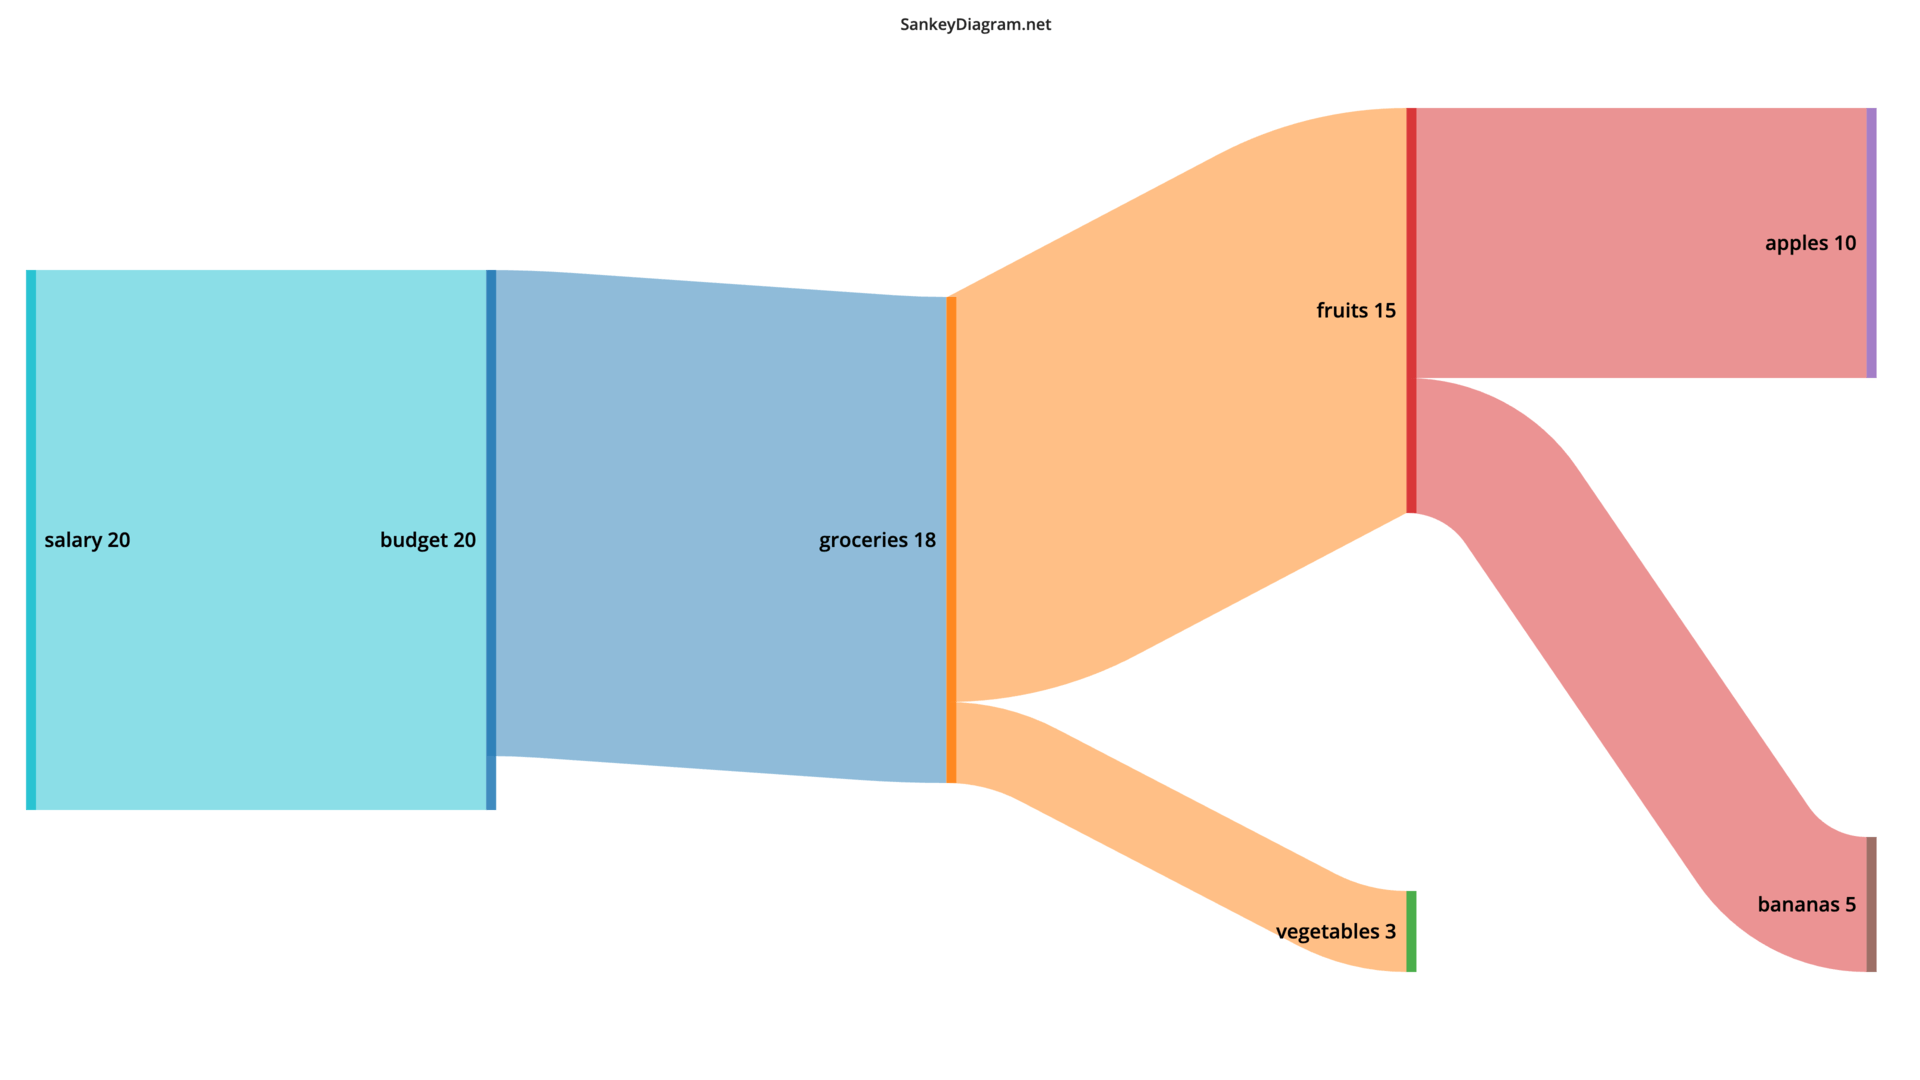
1. What are Sankey Diagrams?
Sankey Diagrams (also known as Sankey Charts, Sankey Graphs or Sankey Plots) are a type of flow diagram for data visualization. They illustrate the flow of values (like money, resources, energy) through a system. One of their most fitting uses is for visualizing the flow of money in budgets and thus are a valuable tool for personal finance budget planning.
Due to their easy-to-understand visualization, they became a widely used model to represent different types of data in engineering, physics, and other fields of science.

You can also check out the chart-examples page for inspiration.
Fun Fact: Sankey Diagrams are named after Irish Captain Matthew Henry Phineas Riall Sankey who used this visualization back in 1809.
2. What is SankeyDiagram.net?
SankeyDiagram.net is a flexible and 100% free and open source web-tool to easily create Sankey Diagrams in your browser.
Using this online sankey plotting software does not cost any money, nor do we track or use your inputted data.
You can export your created diagrams as normal png image, svg vector image, .txt text-file or as a shareable link.
3. How to create a Sankey Diagram using sankeydiagram.net
See How To Create a Sankey Diagram to find out how you can use sankeydiagram.net to create diagrams to your specifications.
4. What kind of data can be represented with Sankey Diagrams?
Sankey Charts are ideal for visualizing the flow of data, particularly for representing money-flows, costs, earnings and expenses, budgets, energy, or material transfers between processes. They can illustrate complex networks, visualising relationships between sources, paths, and destinations. Common uses include tracking personal finance income and expenses, financial results of businesses and organizations, energy flows, or material consumption of projects.
5. What is a good use for Sankey Diagrams in business and finance?
Various examples where Sankey Diagrams can easily be used to visualize data, resources, and processes in a business and finance context:
- Visualizing the earnings and expenses (or cash-flow) of a company's fiscal year
- Visualizing the share of specific sub-budgets in a total budget
- Showing the number of applicants to a company and where they dropped out in the interview process
- Explaining the user journey on a website or e-commerce store
- Plotting the use and loss of resources in an organization
- Planning your personal-finance budget
6. Do I need to sign-up to create a Sankey Visualisation with sankeydiagram.net?
No, you don't need to sign-up. You can use everything for free, directly in your browser. No Sign-Up, no Ads.