1. What Is a Sankey Diagram Budget?
A Sankey Diagram Budget is a powerful way to visualize the flow of your income and expenses, making it easier to understand where your money goes and how you can optimize your personal finances. Whether you’re managing a household budget, tracking business expenses, or simply looking to gain better financial insight, a Sankey Budget diagram offers clarity that traditional spreadsheets can’t match
A Sankey Diagram Budget uses nodes and flows to represent financial categories and the movement of money between them. The width of each flow is proportional to the amount, making it easy to spot your biggest expenses or sources of income at a glance. This approach is ideal for personal finance because it provides an intuitive, visual summary of complex budget data
2. Why Use a Sankey Budget Diagram for Personal Finance?
- Immediate Clarity: Instantly see where your income is allocated-essentials, savings, discretionary spending, and more.
- Identify Patterns: Spot trends, bottlenecks, or areas of overspending that might be hidden in tables or lists.
- Engage Others: Great for sharing with family members, household members, or friends to discuss budgeting decisions and ask for help.
- Scenario Planning: Easily visualize how changes in income or expenses affect your overall financial health.
3. How to Create a Sankey Diagram Budget
1. Gather and Organize Your Financial Data
Start by listing all sources of income and all categories of expenses. For a Personal Finance Sankey Diagram, typical nodes might include:
- Income: Salary, freelance work, investments
- Expenses: Rent, groceries, utilities, entertainment, savings, debt payments
2. Structure Your Data for the Diagram
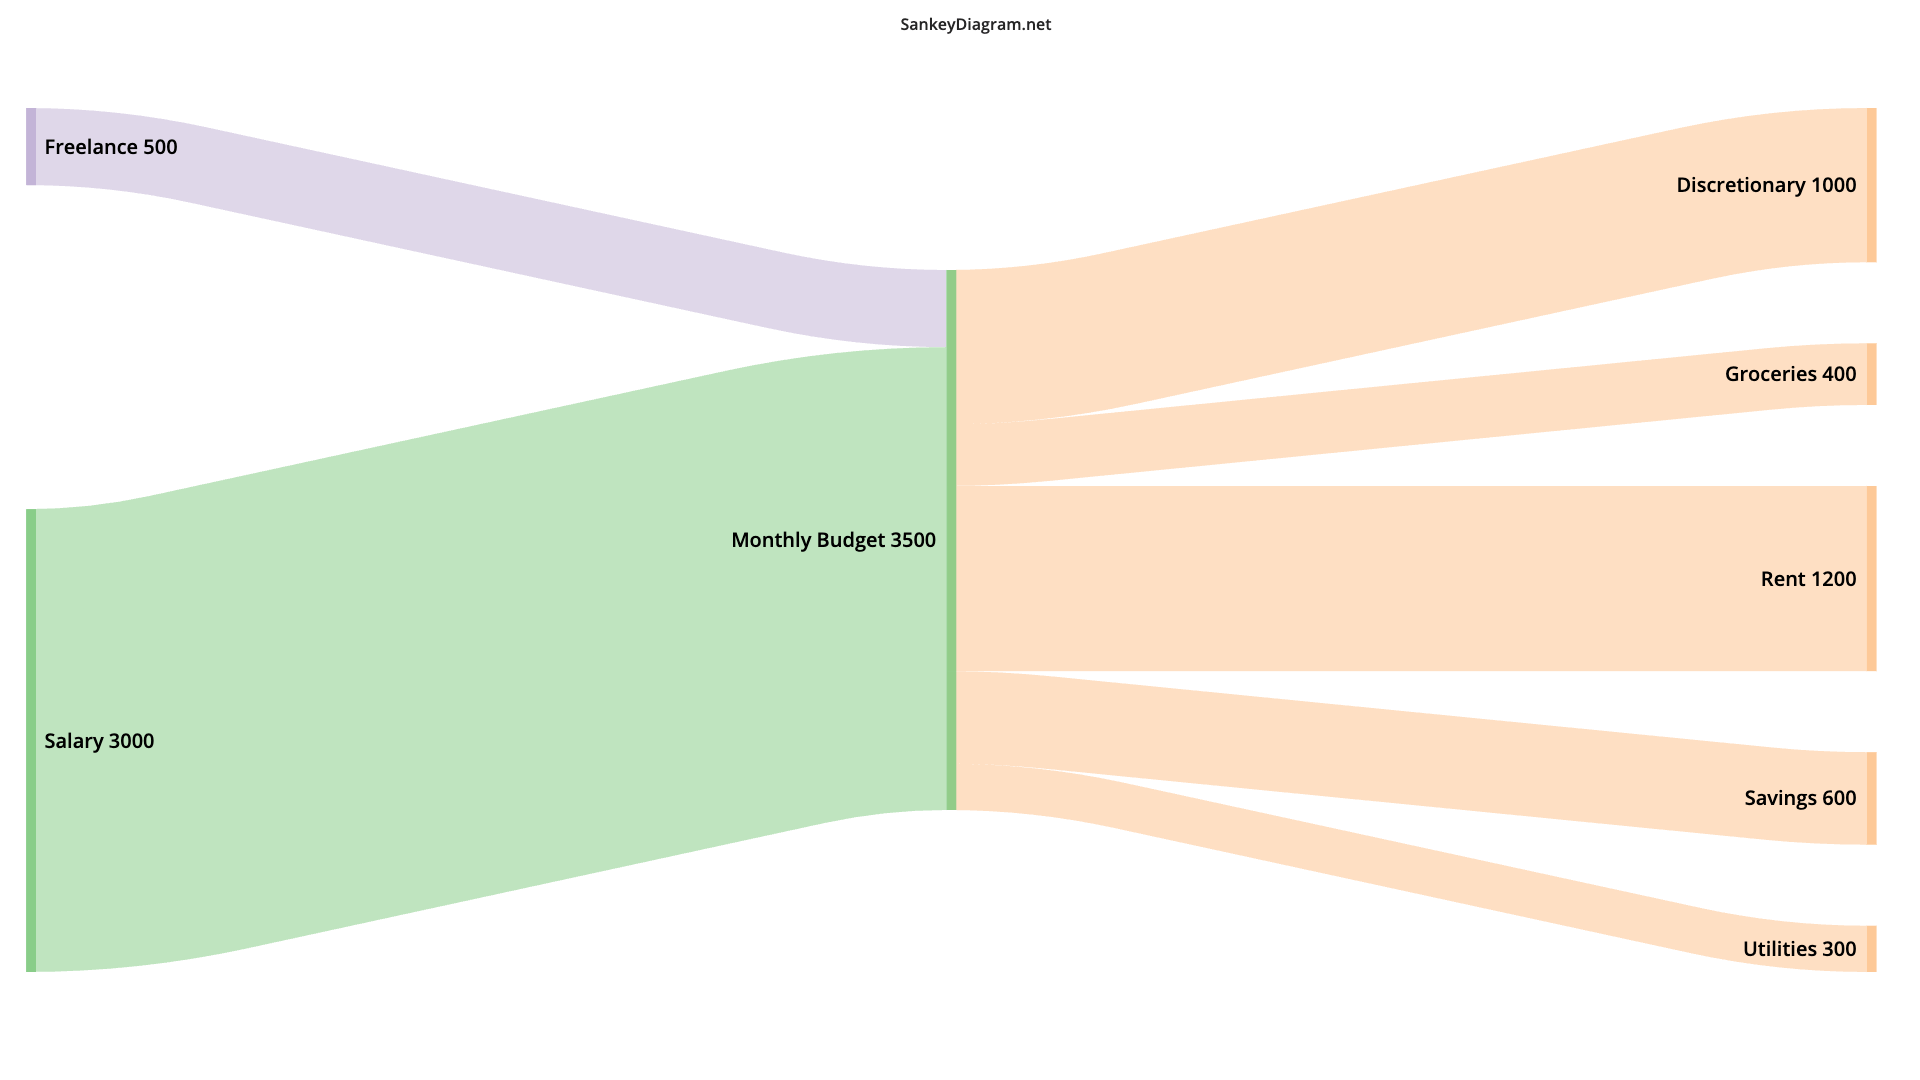
Each flow in a Sankey diagram connects a source (e.g., “Salary”) to a target (e.g., “Monthly Budget”), and then from the budget pool to various expenses. The amount determines the thickness of the flow. Example Data Format:
Salary [3000] Monthly Budget
Freelance [500] Monthly Budget
Monthly Budget [1200] Rent
Monthly Budget [400] Groceries
Monthly Budget [300] Utilities
Monthly Budget [600] Savings
Monthly Budget [1000] Discretionary
See How To Create a Sankey Diagram to find get more details on how you can use sankeydiagram.net to create financial diagrams to your specifications.
3. Analyze and Optimize
- Review Flows: Look for oversized flows (e.g., high rent or entertainment costs) and consider where you can adjust spending.
- Scenario Testing: Modify the data to see how changes (like a raise or new expense) impact your budget.
- Share & Discuss: Use the Export function to share your Sankey Budget with friends or on reddit to get improvement suggestions.
4. Best Practices for Creating a Personal Finance Sankey Diagram
- Be Accurate: Use real financial data for the most useful insights.
- Keep It Simple: Don’t overcrowd the diagram-group small expenses if necessary for readability.
- Use Consistent Colors: Assign colors to categories (e.g., red for debt, green for savings) to make the diagram easy to interpret.
- Update Regularly: Refresh your diagram monthly or quarterly to track progress and adjust your budget.
5. Do I need to sign-up to create a Budget Visualisation with the SankeyDiagram tool?
No, you don't need to sign-up. You can use everything for free, directly in your browser. No Sign-Up, no Ads.
The tool is Open-Source and we do not store your data.